Building Audit-Based Alerting for Sensitive Cloud Storage Buckets
Introduction
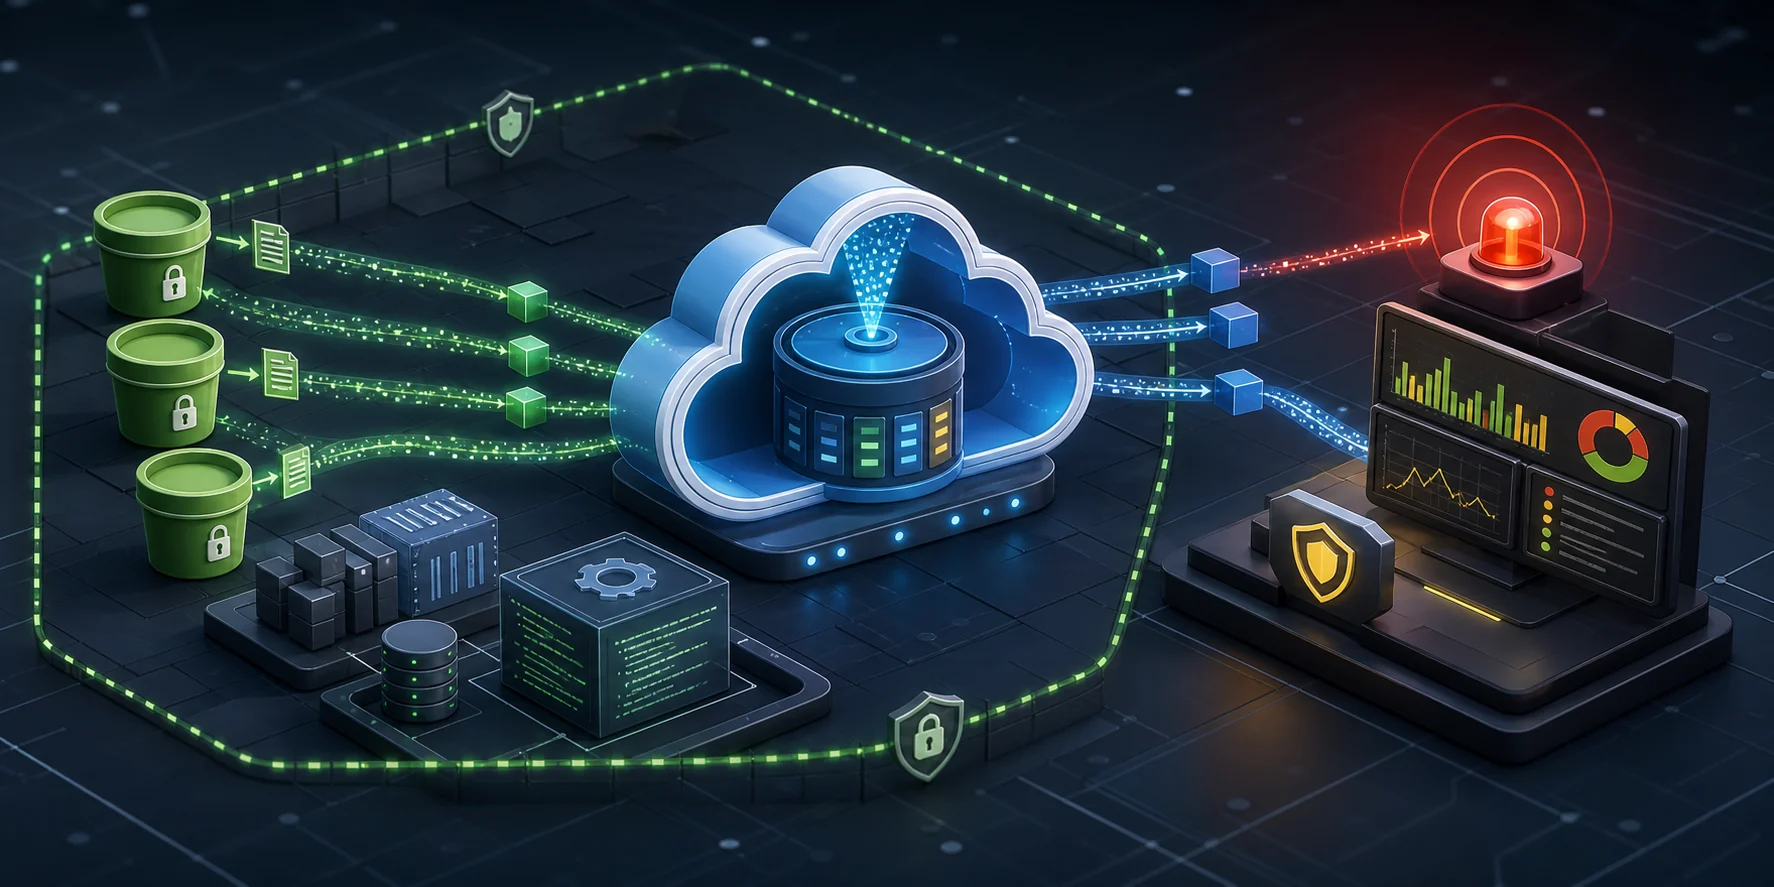
Sensitive research environments often have a simple rule hiding a difficult engineering problem: data should be usable inside the environment, but it should not quietly leave it.
I worked on a Google Cloud alerting design for a Trusted Research Environment where users can legitimately read controlled data from approved virtual machines. Alerting on every object read would have been noisy and unhelpful. The useful signal was narrower: a successful read from a sensitive Cloud Storage bucket outside the approved network path. We also included object deletes as a high-signal destructive event.
This post walks through the architecture I designed and implemented with Terraform.
The Goal
The environment had three broad project types:
- Sandbox projects, where researchers work in isolated environments.
- A library project, where shared sensitive datasets can live.
- A master project, where central platform services are managed.
Some buckets are intentionally downloadable. Other buckets contain controlled data and should only be read from approved TRE network ranges.
The control needed to answer one operational question:
Did a successful Cloud Storage object read or delete happen against a sensitive bucket from outside an approved TRE source?
We were not trying to alert on every failed attempt. Failed reads are useful for investigation, but successful movement or deletion of data is the higher-priority signal.
Design Goals
The design had a few constraints:
- Use Google Cloud native services where possible.
- Avoid custom detectors, scheduled scanners, or event-processing code unless necessary.
- Keep alert noise low enough that every incident is worth opening.
- Preserve enough centrally stored logs for investigation.
- Keep object names out of metric labels and broad notifications.
- Manage the whole pattern with Terraform.
- Roll the control out project by project with feature flags.
The final design uses Cloud Audit Logs, Cloud Logging sinks, a central Cloud Logging log bucket, a bucket-scoped log-based metric, and a Cloud Monitoring alert policy.
Architecture Overview
At a high level, each enabled source project keeps its normal local audit logs, but also routes a filtered copy of relevant Cloud Storage access events into a central Cloud Logging log bucket in the master project.
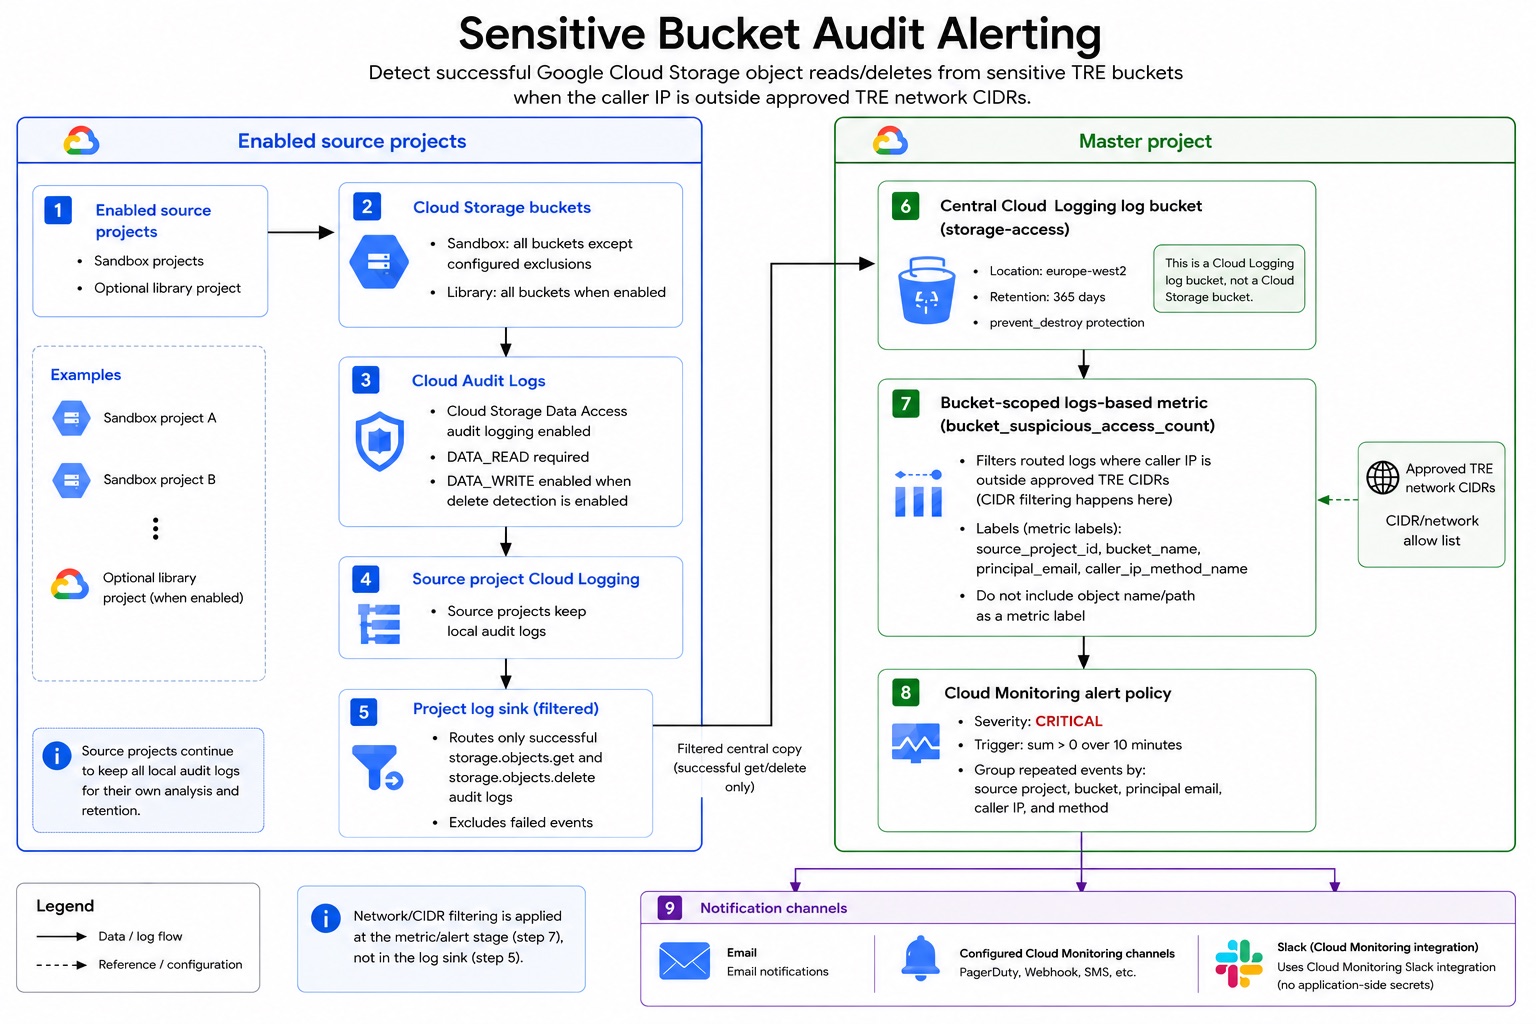
The flow is:
Source projects
  Cloud Storage buckets
    -> Cloud Audit Logs
    -> Source project Cloud Logging
    -> Project log sink
    -> Master project Cloud Logging log bucket
    -> Bucket-scoped log-based metric
    -> Cloud Monitoring alert
    -> Email or Monitoring notification channels
The central bucket is a Cloud Logging log bucket, not a Cloud Storage bucket. That distinction matters: the system is routing log entries through Cloud Logging, not copying audit data into object storage.
Bucket-scoped log-based metrics fit this pattern well because they can evaluate entries stored in a specific log bucket, including entries that originated in other projects.
Step 1: Route the Right Audit Events
The source project sink routes successful Cloud Storage object access events for scoped sensitive buckets:
log_id("cloudaudit.googleapis.com/data_access")
resource.type="gcs_bucket"
protoPayload.serviceName="storage.googleapis.com"
(
  protoPayload.methodName="storage.objects.get"
  OR protoPayload.methodName="storage.objects.delete"
)
NOT protoPayload.status.code:*
The real sink filter then adds bucket scoping: include the sensitive buckets and exclude buckets that are intentionally public, downloadable, or otherwise out of scope.
For reads, Cloud Storage Data Access audit logging needs DATA_READ. If delete detection is enabled, DATA_WRITE is also required because object deletes are write-classified data access events.
The important design choice is that the sink does not apply the outside-network check. It routes all successful reads and deletes for scoped sensitive buckets. The network condition is applied later by the metric and alert policy.

That gives two benefits:
- The central log bucket remains useful for investigation, even when an event does not alert.
- The alerting logic can be adjusted without changing every source project sink.
Step 2: Alert on the Network Signal
The master project owns a bucket-scoped log-based metric over the central log bucket. The metric counts events where the caller IP is not inside an approved TRE CIDR:
NOT (
  ip_in_net(protoPayload.requestMetadata.callerIp, "<APPROVED_CIDR_1>")
  OR ip_in_net(protoPayload.requestMetadata.callerIp, "<APPROVED_CIDR_2>")
)
This is intentionally conservative. In Cloud Logging filters, ip_in_net returns false if the field is missing, defaulted, or not a legal IP address. With the NOT (...) wrapper, those cases become suspicious instead of being silently trusted.
The metric extracts a small set of labels for investigation:
Object names are deliberately not labels. They can create high-cardinality time series, increase cost and noise, and leak sensitive metadata into alert notifications.
The Cloud Monitoring alert policy is intentionally simple:
Severity: CRITICAL
Condition: sum over 10 minutes > 0
Grouped by: source project, bucket, principal, caller IP, and method
That grouping collects repeated events from the same actor and source into one incident, while still allowing distinct users or source IPs to open separate incidents.

Step 3: Make It Repeatable with Terraform
The implementation is controlled by feature flags.
At the global level:
bucket_audit_alerting = {
  enabled                       = true
  library_project_enabled       = false
  include_deletes               = true
  log_bucket_id                 = "storage-access"
  log_bucket_location           = "europe-west2"
  retention_days                = 365
  additional_approved_cidrs     = []
  excluded_sandbox_bucket_names = []
  notification_channel_names    = []
}
At the sandbox level:
The Terraform creates:
- Cloud Storage Data Access audit logging for enabled projects.
- Source project Cloud Logging sinks.
- A central Cloud Logging log bucket with 365-day retention.
- IAM for sink writer identities.
- A bucket-scoped log-based metric.
- A Cloud Monitoring alert policy.
- Email or existing Monitoring notification channels.
The central log bucket has prevent_destroy = true to reduce the chance of accidental deletion through Terraform.
Validation and Edge Cases
One of the main lessons was that audit log filters need to be tested with real log entries, not guessed from memory. Cloud Logging fields for Cloud Storage access are precise, and small differences in query syntax matter.
For example, this pattern worked reliably for excluding approved internal source ranges:
That filter should be tested with:
- A successful object read from an approved TRE VM.
- A successful object read from outside the approved CIDRs.
- A successful object delete, if delete detection is enabled.
- A log entry with a missing, redacted, or non-IP caller field.
- A bucket that is intentionally excluded.
There are also Cloud Storage audit logging limitations to keep in mind. Cloud Audit Logs do not track access to public objects, and some authenticated browser download paths can redact principalEmail and callerIp when the download happens outside the Google Cloud console. Those cases need explicit validation before relying on the alert as a complete exfiltration control.
Finally, log-based metrics do not backfill old logs. After creating a metric, generate a fresh matching event to validate the metric and alert path.
Cost Considerations
The main cost driver is Cloud Logging volume and retention:
- Source projects keep their normal audit logs.
- The central log bucket stores a filtered copy of successful sensitive bucket reads and deletes.
- Retention beyond the default period adds storage cost.
- User-defined log-based metrics are Cloud Monitoring custom metrics.
The design controls cost by:
- Routing only
storage.objects.getand, when enabled,storage.objects.delete. - Excluding intentionally downloadable buckets.
- Avoiding high-cardinality metric labels such as object path.
- Rolling out per project with a feature flag.
- Reviewing log volume after the first full billing week.
For most environments, this is cheaper and simpler than triggering custom code for every audit event.
Why This Pattern Worked
This design gives the platform team a focused detection path:
- Native audit source.
- Central retention.
- Minimal custom code.
- Clear Terraform ownership.
- Alert grouping to avoid notification spam.
- Enough context in each incident to investigate quickly.
It also keeps the architecture flexible. If the definition of an approved network changes, the metric filter can be updated. If more buckets become intentionally downloadable, they can be excluded from the sink. If additional notification channels are approved later, they can be added through Cloud Monitoring without putting webhook tokens into application code.
Future Improvements
The next useful improvements would be:
- Move from broad project-level sink writer permissions to log-bucket-level IAM where the provider and module structure support it cleanly.
- Add dashboards for access volume by project, bucket, and principal.
- Add a separate low-severity control for denied access attempts.
- Periodically review excluded buckets to make sure they are still intentionally public or downloadable.
- Add automated validation tests that generate a harmless object read and confirm the metric increments.
The Takeaway
Good security alerting is not just about catching everything. It is about choosing the right signal, keeping the noise low, and making sure the person receiving the alert has enough context to act.
For this use case, Cloud Audit Logs plus Cloud Logging and Cloud Monitoring provided a strong native foundation. Terraform made the pattern repeatable across projects, and the central log bucket gave the team a reliable place to investigate suspicious access without building a custom detection pipeline from scratch.